FRBNY Global Supply Chain Pressure Index
Commentary by Kathleen Tyson - January 7, 2022
Staff at my old employer, the Federal Reserve Bank of New York, have innovated a new index to monitor global supply chain pressure, the Global Supply Chain Pressure Index or GSCPI. It is useful, but is very US and G6 focussed, so not very relevant to the rest of the world. Fair enough, they are the New York Fed.
It's interesting what the compilers chose to include: shipping costs, US inward and outward air freight costs, PMI components on delivery times, backlogs, and purchased stocks for just 7 economies.

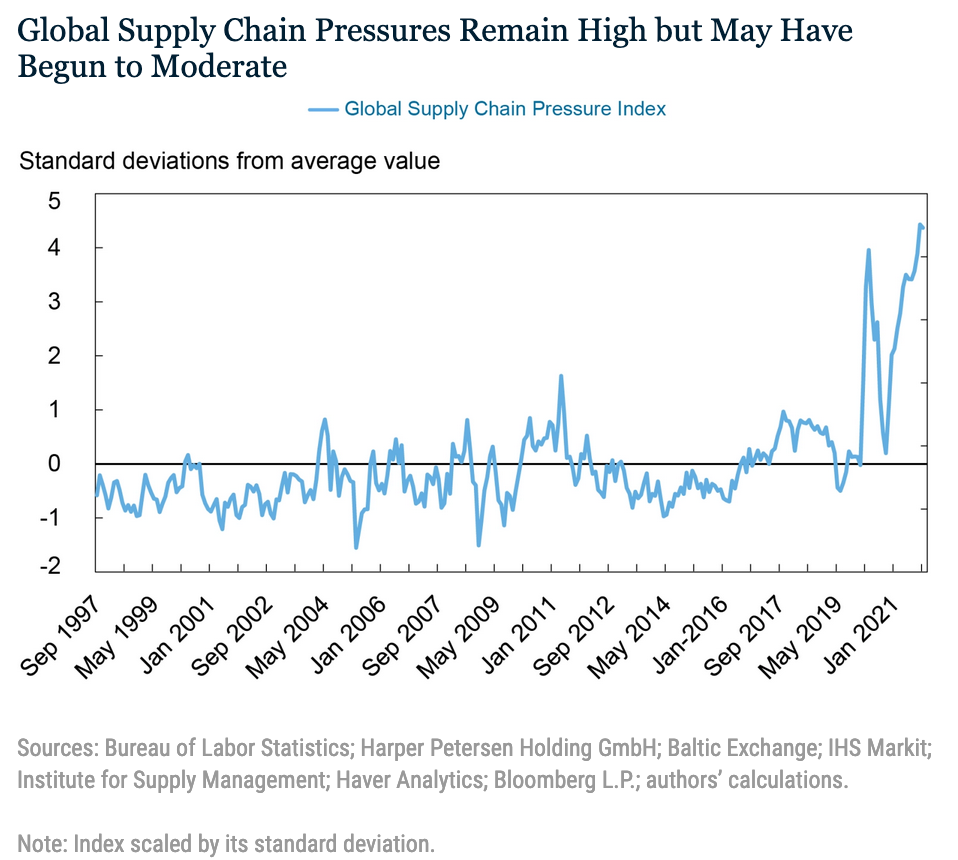
The GSCPI is useful for looking back to see how natural disasters such as earthquakes and floods disrupted supply chains, as well as financial shocks like the Global Financial Crisis and a record spike for the Covid pandemic.
The GSCPI oscillates over time, with several episodes that are noteworthy. We note a fall and then a rebound in the index during the GFC. While our empirical methodology attempts to purge demand factors before constructing the GSCPI, it is not a perfect measure and its dynamics during the GFC likely still capture some demand components. The GFC-period variation in the index is not as large as the moves seen in later periods, which arguably capture stronger supply-side factors. In 2011, we see a substantial rise in the index, attributable to two natural disasters. The first is the Tōhoku earthquake and resulting tsunami, which had an impact on both Japanese and foreign production, given that the affected regions were a center for automobile manufacturing. The second event involved flooding in Thailand, which inundated seven of the country’s largest industrial estates, affecting the global production chains of the auto and electronics industries. The index rises again during the China-U.S. trade disputes of 2017-18, as firms had to adjust their global procurement strategies.
The spikes in the GSCPI associated with the aforementioned events pale in comparison to what has been observed since the COVID-19 pandemic began. First, we observe that the GSCPI jumps at the beginning of the pandemic period, when China imposed lockdown measures. The index then fell briefly as world production started to get back online around the summer of 2020, before rising at a dramatic pace during the winter of 2020 (with COVID resurgent) and the subsequent recovery period.
The commentary that accompanies launch of the GSCPI says, "GSCPI seems to suggest that global supply chain pressures, while still historically high, have peaked and might start to moderate somewhat going forward." That statement seems unjustified based on a minor downtick in the data which happened before the Omicron variant of Covid began its global spread with renewed lockdowns, labour shortages, and port disruptions. It also ignores the growing climate risks which could make climate-related disruption a larger and more persistent risk.
Supply chain delays were former Fed chair Alan Greenspan's favoured forward indicator of inflation. It would be interesting to see inflation overlaid on the GSCPI.
What seems a bit odd to me for a central bank index is that they ignore the financial sector as an element in supply chains and trade finance. Banks are withdrawing from trade finance at speed globally because it is expensive, complicated, paper-based, prone to domestic regulatory and political interference and corruption, subject to inconsistent national legal and regulatory requirements, and exposes them to high risk of regulatory scrutiny and fines for operational or process failures. Many banks have quite simply lost their appetite for trade and supply chain finance as the complexity of pandemic challenges and digitalisation drives their priorities toward more profitable sectors. The 15 percent growth of the Trade Finance Gap to USD 1.7 trillion in 2021 is evidence that there is a failure in the global trade finance system that central banks are not yet recognising or addressing.
UPDATE: 25/01/2022 Bloomberg has a handy summary of other new Supply Chain indices:
The New York Fed launched its pressure gauge this month
Kuehne+Nagel just published its Seaexplorer disruption indicator
Flexport has developed the Logistics Pressure Matrix
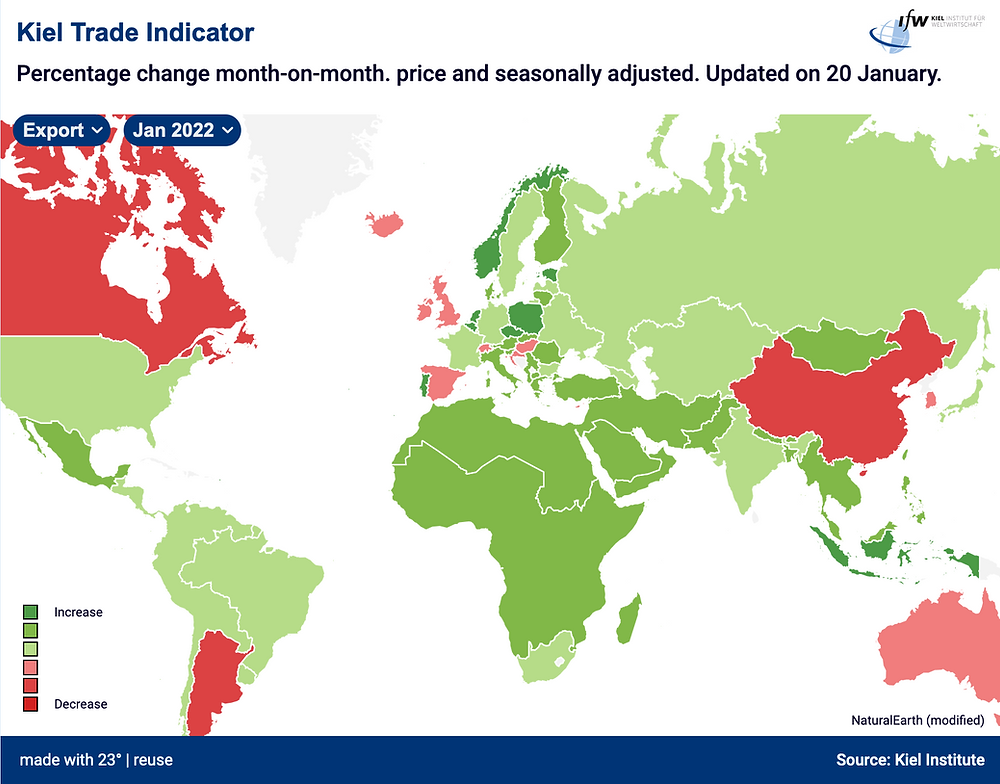
The Kiel Institute for the World Economy’s updates its Trade Indicator twice a month
The White house is monitoring a dashboard, too.
Most interesting because of its more global view, the Kiel Trade Indicator shows a general global recovery in trade (although some of this growth may be masking inflation in prices), but a rapid slowdown in exports from China where the Omicron variant has lead to reintroduction of many controls.
